
Logs
A centralized hub where you can access and analyze logs from your applications deployed on Salus. Here’s what you can do:
- Search your logs using keywords to quickly find the information you’re looking for
- Filter logs based on their severity level (such as Trace, Debug, Information, Error, and Warning) and by date time range
- See at a glance how your log volume breaks down across severity levels
- View the log table showing the log details, timestamp, and severity
- Chart log volume per severity over time — the chart adapts its intervals to the time range you select
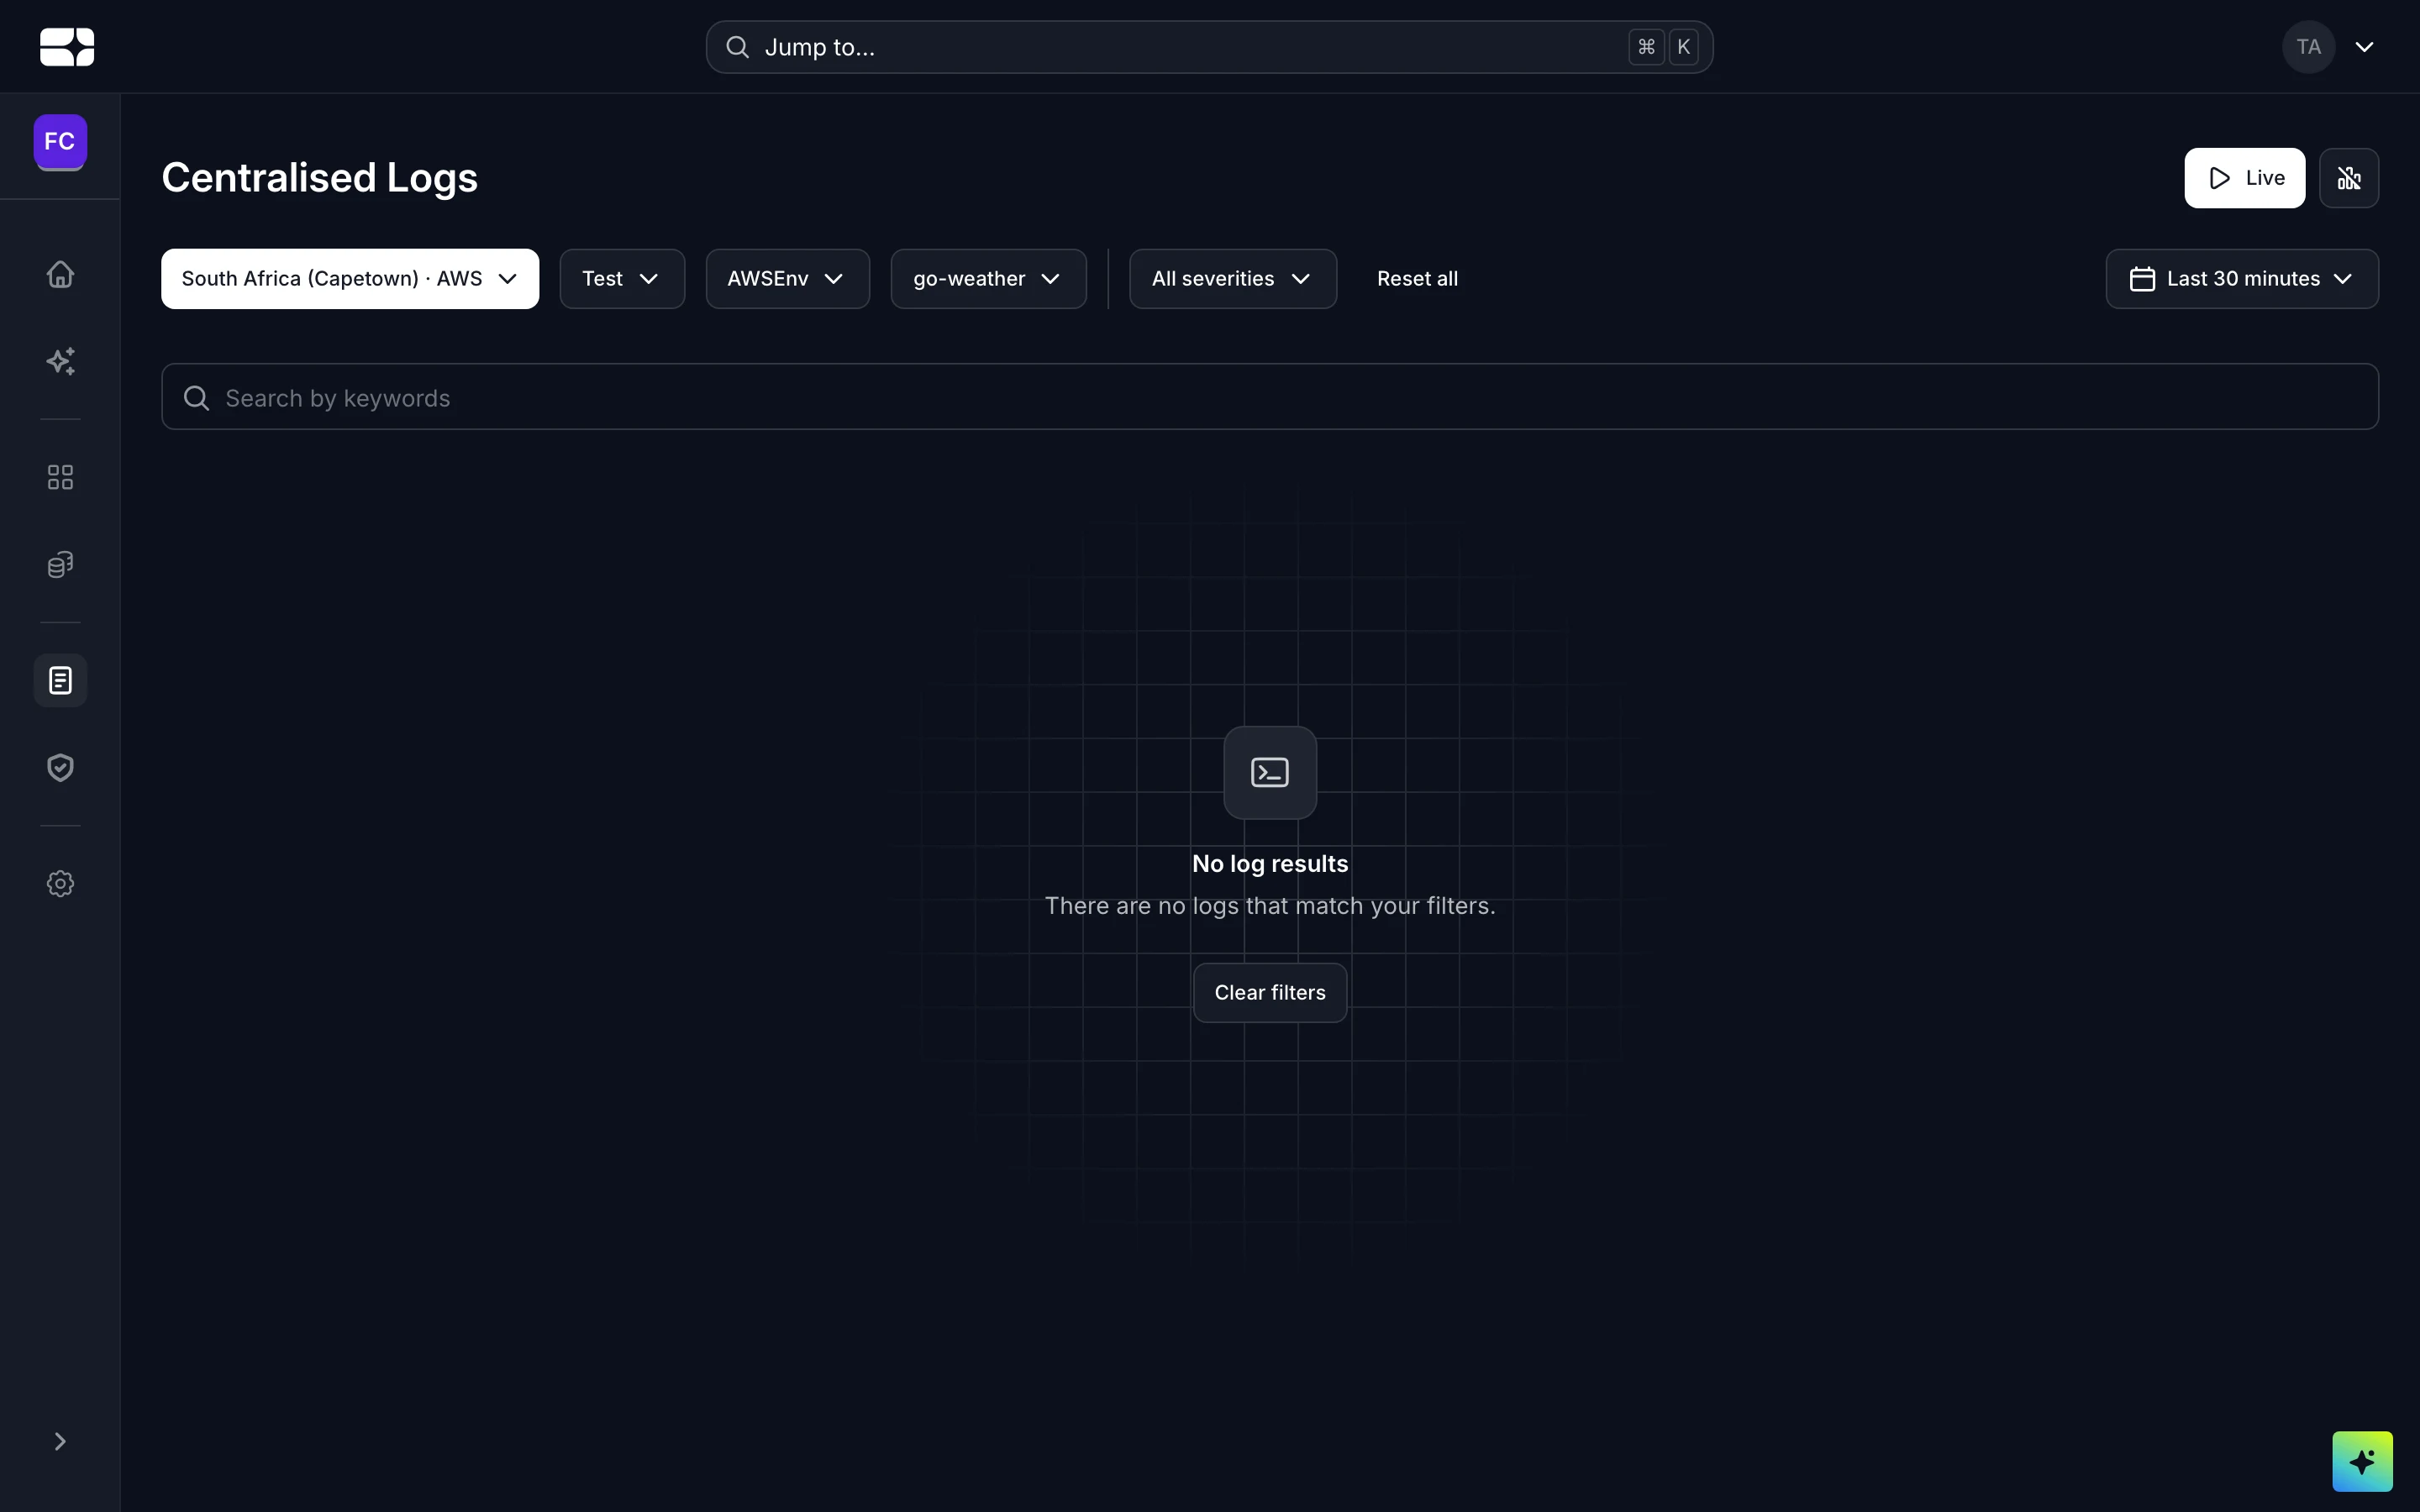
Centralised logs, filtered down to a single project's environment
- Trace: the finest level of granularity, providing detailed tracking and visibility into the application’s flow
- Debug: offers insights primarily for development and troubleshooting
- Information: general operational entries about the application’s normal behavior
- Warning: an indication that something unexpected happened, or may happen soon
- Error: shows that a specific operation failed, causing an exception or an unexpected behavior
Filtering Through Centralized Logs
Select a Region
Logs are scoped to a region — where your workloads run. The filter starts on your organization’s default region, so you can go straight to the other filters; switch it to see logs from workloads running in a different region.
Select a Workspace
All users can access granular filters by first selecting a workspace. Only a single workspace can be selected at a time. Once a workspace has been selected, the rest of the filters will be active.
Select an Environment
After selecting a workspace, environments in that workspace will be made available in the filters. To find additional environments, ensure to select the workspace that particular environment belongs to
Select Projects
Once you have selected a workspace and environment, projects that have deployments configured will appear in the filters for further interrogation
Troubleshooting
- No logs are showing. The granular filters activate only after you select a workspace — pick one first, then narrow by environment and project. Also check the region filter: logs are scoped to the region your workloads actually run in.
- Older entries are missing. Logs age out per your plan’s retention policy — download anything you need to keep before it does.
- A project doesn’t appear in the filter. Only projects with configured deployments show up; check the project has a release configuration in the selected environment.