
Metrics
Salus’ centralized metrics view highlights critical system and application issues using Request, Error and Duration (RED) metrics. These metrics surface when something requires immediate attention, such as high error rates, failing services and more. By centralizing these metrics in one place, you can quickly spot and respond to problems without digging through multiple tools or logs. This focused view helps ensure you’re aware of the most urgent risks affecting your applications in production.
Accessing your application metrics
There are two ways to reach your application’s metrics:
- From a project’s deployment page, click the Observability button — it takes you straight to that deployment’s metrics. (The button activates once the environment is configured and has a deployment.)
- Click the metrics icon on the left-hand navigation panel and select from the list of existing projects in your workspace.
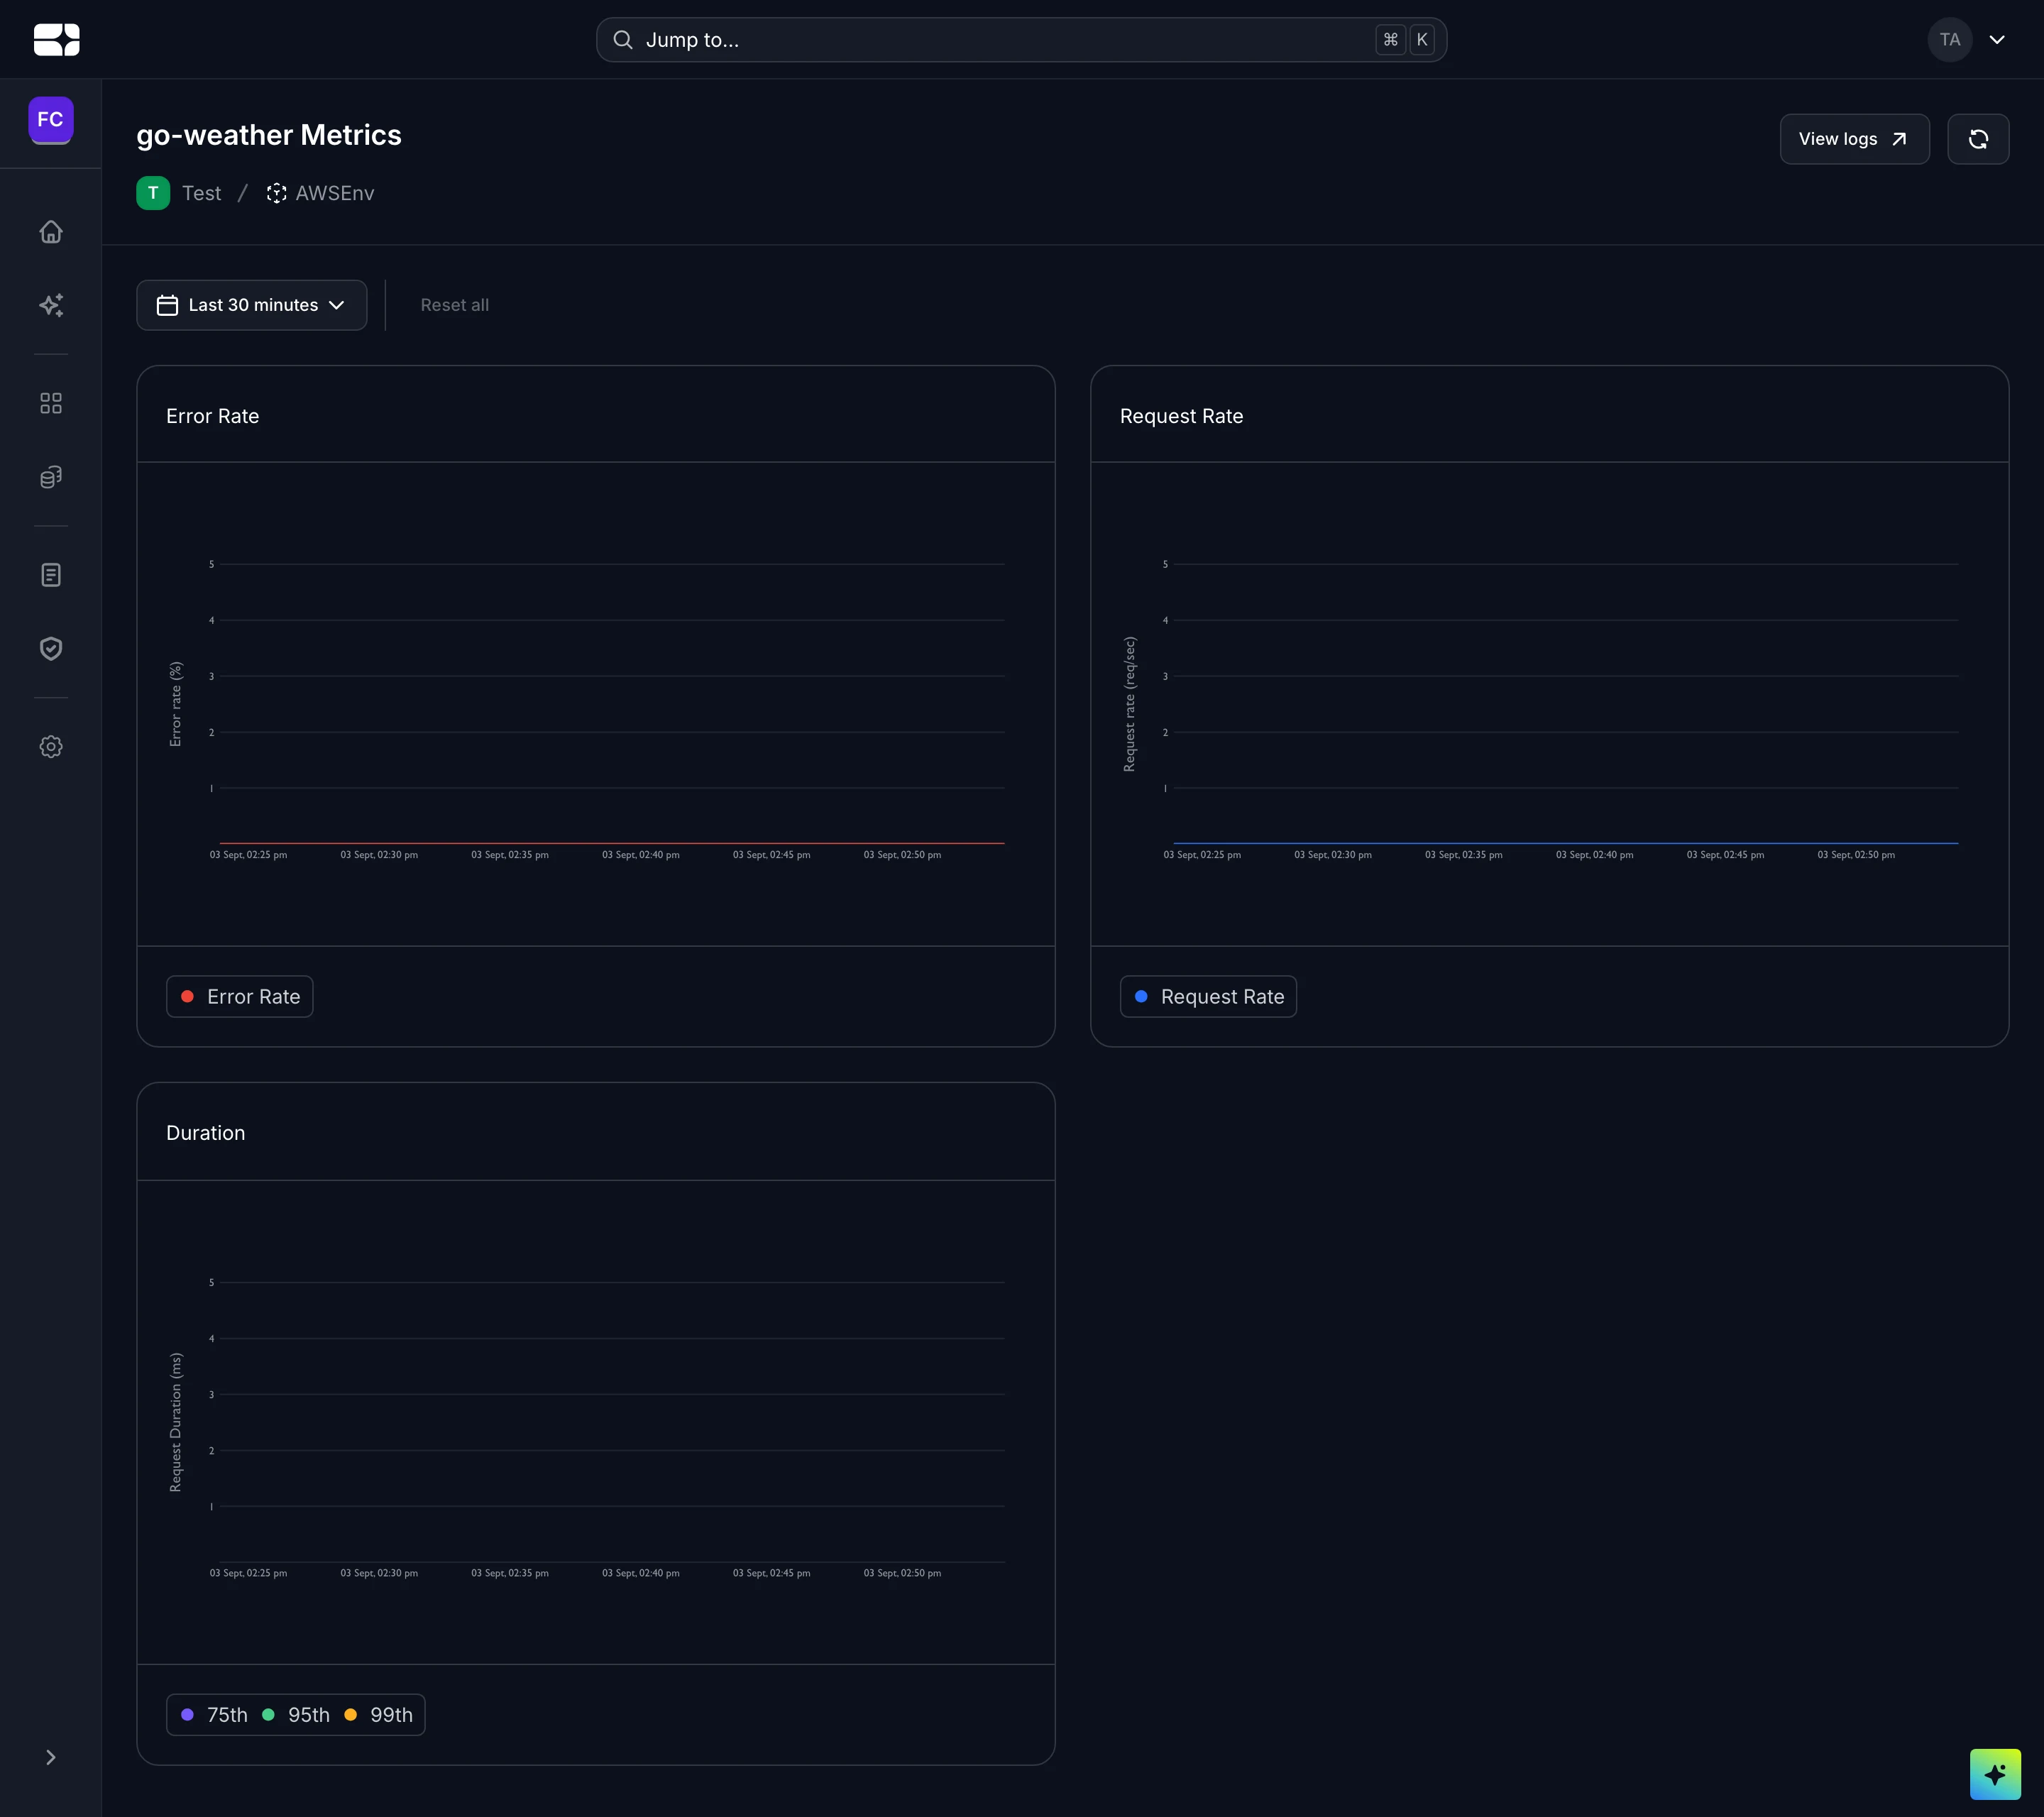
Error rate, request rate and duration percentiles for a deployment
What you see
Three charts, side by side, for the deployment you’ve selected:
- Request rate (requests/second) — immediate recognition of traffic spikes, aiding scaling decisions, infrastructure planning, and keeping user experience healthy during peak times.
- Error rate (% of requests) — a rising error rate is your earliest trigger for investigation, before users start telling you about it.
- Request duration (milliseconds, at the 75th, 95th, and 99th percentiles) — not just the average but the outliers, so you can target optimizations where they matter.
Charts cover the time range you select — the default is the last 30 minutes, and you can widen it with the range filter. How far back you can look is bounded by your plan’s metrics retention policy.