
Pipeline Details
The Pipeline Details page provides a comprehensive view of a specific pipeline within Salus. Use this page to monitor your CI/CD performance, view inputs and outputs and troubleshoot issues. Below is an overview of each section to help you navigate and understand the page effectively.
Pipeline Summary Page
The Pipeline Summary provides a concise overview of your pipeline’s configuration, status, and key performance metrics—extracted automatically after each successful run to help you monitor health and efficiency at a glance.
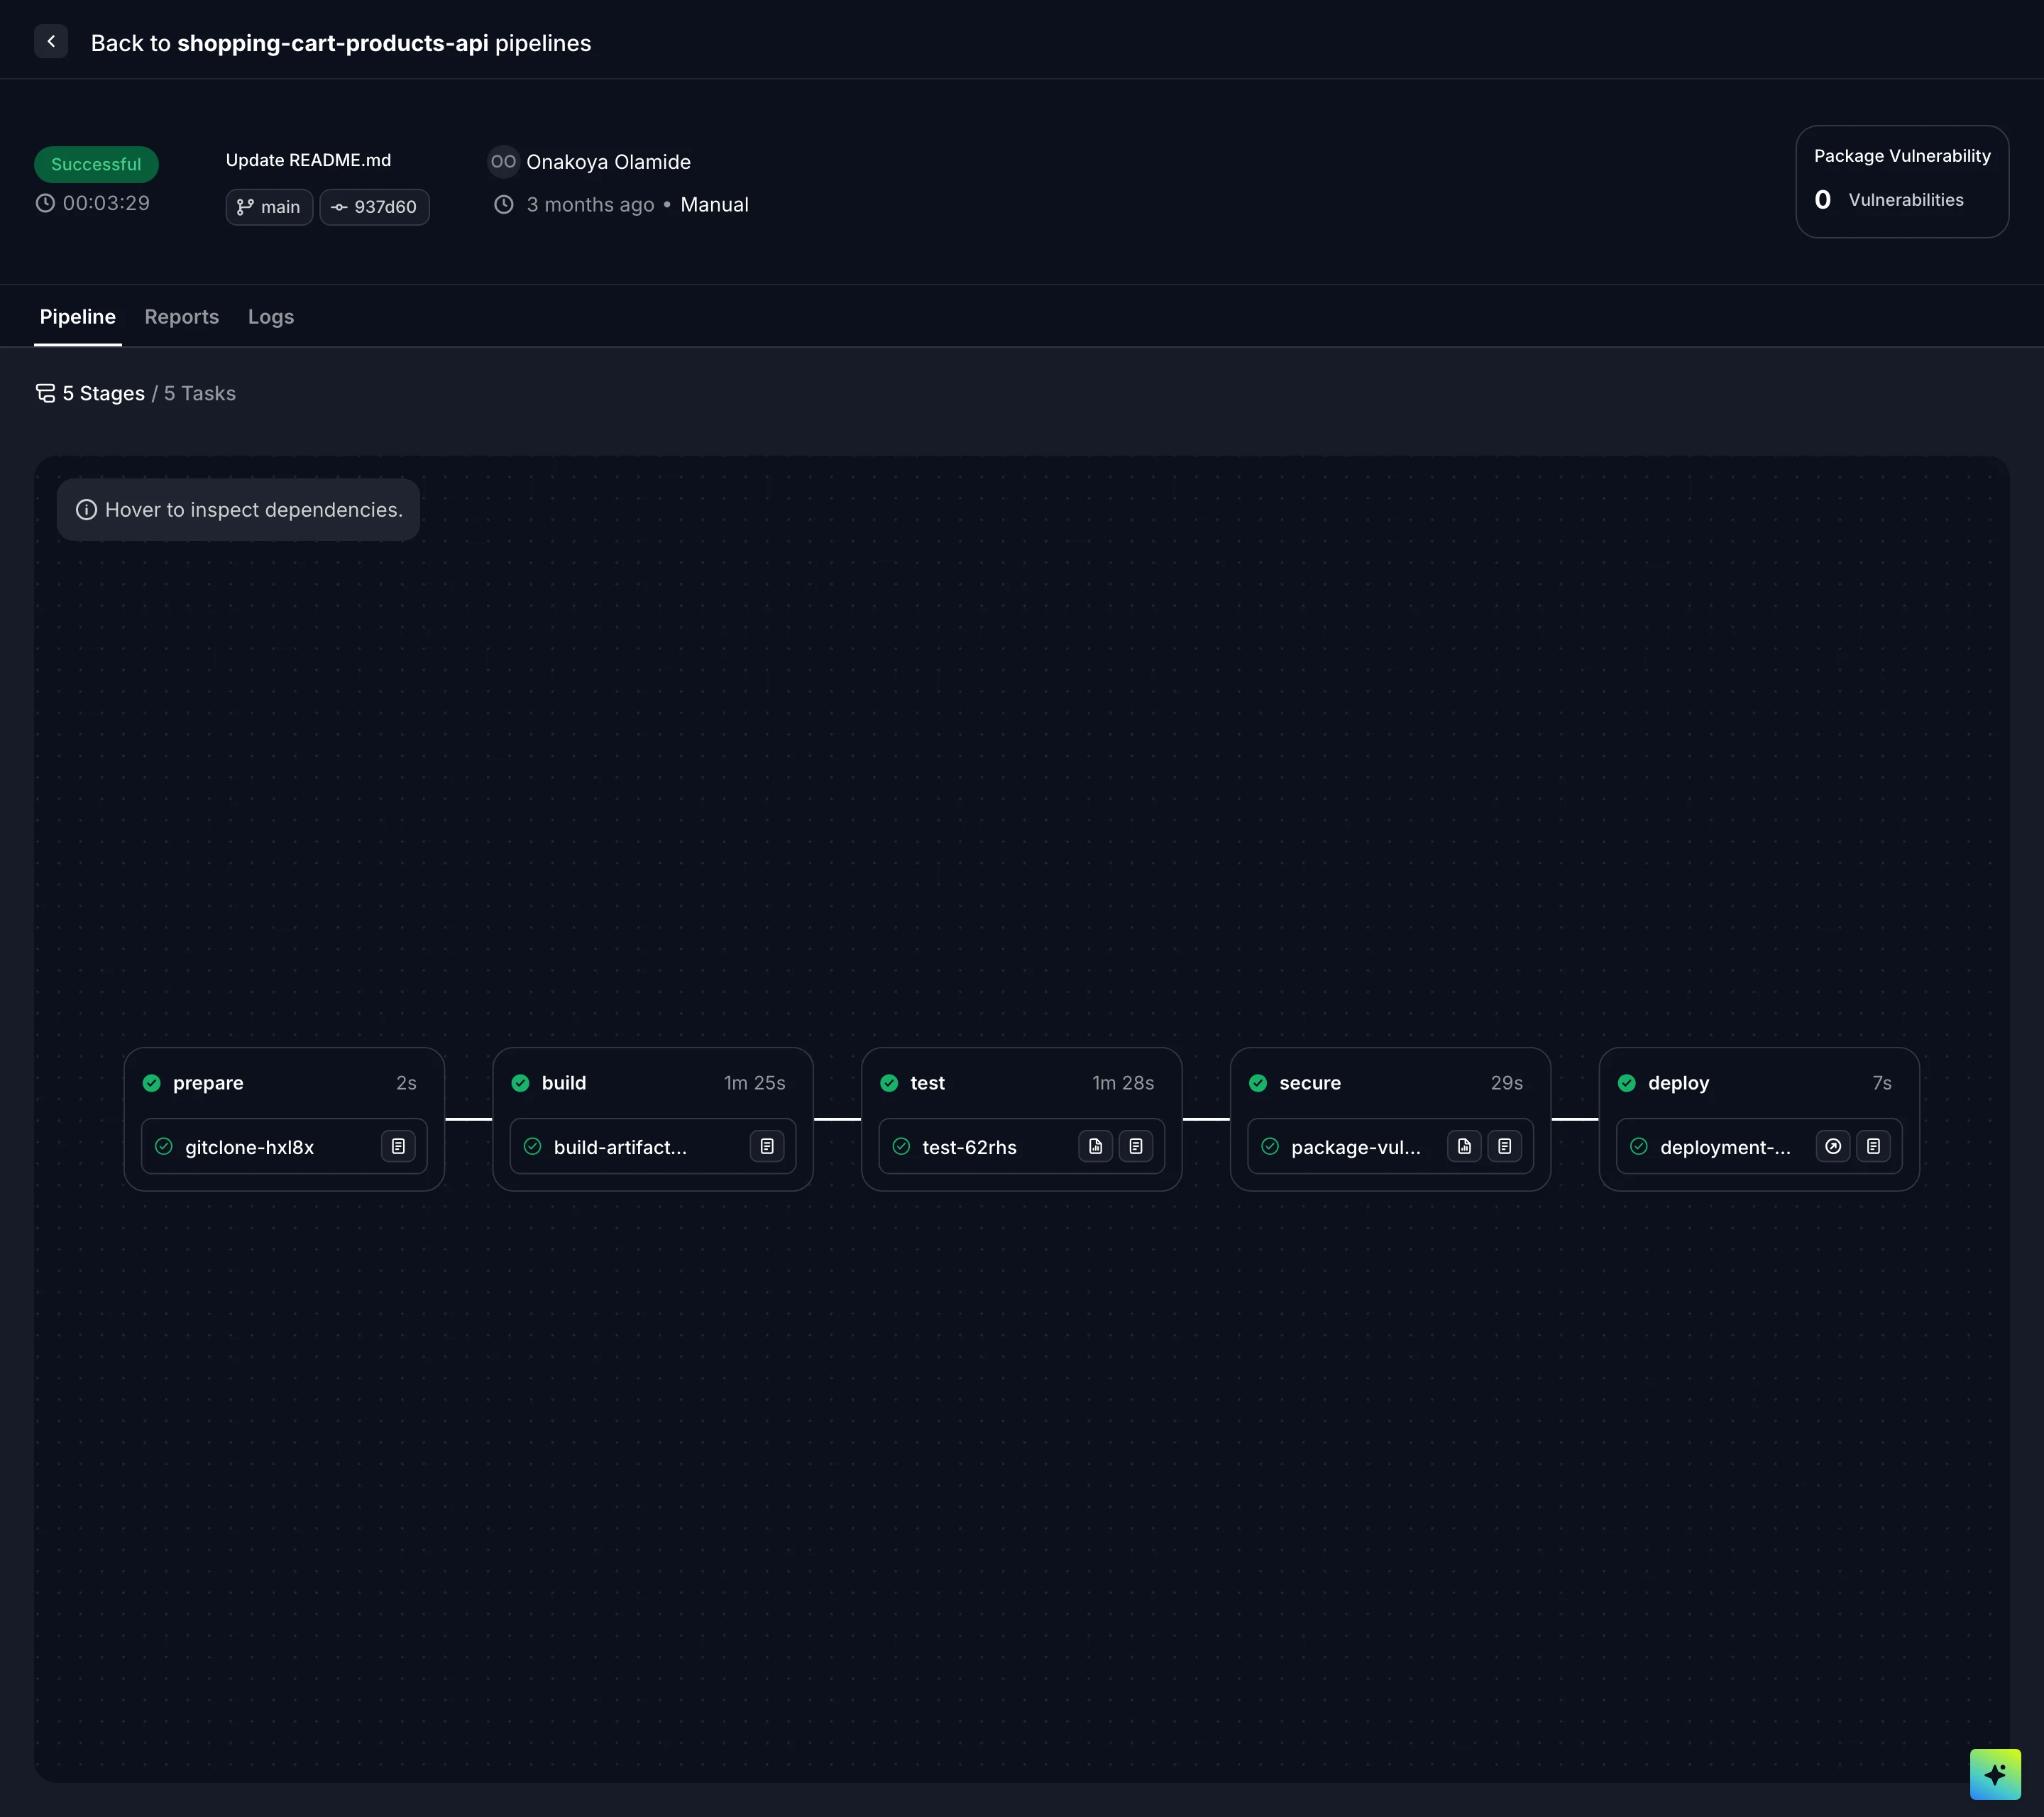
A pipeline run, stage by stage
Status — the overall pipeline status. Learn more about pipeline status types.
Git information
- Commit message
- Branch SHA or tag title
Pipeline trigger information
- Pipeline author
- Trigger date
- Trigger method
Pipeline Metrics

Metrics extracted from the run's stage reports
After each successful run, Salus extracts key metrics from the stage reports so you can gauge the health of the run at a glance, without reading through every report by hand.
| Metric | Description |
|---|---|
| Number of Failures (Test) | Failing tests — business logic or functional bugs where the code behaves incorrectly. |
| Number of Errors (Test) | Tests that crashed — broken code or tests that couldn't be evaluated. |
| Number of Vulnerabilities (Security) | Vulnerabilities found by the package vulnerability scanning stage. |
Pipeline Graph

The pipeline graph, stage by stage
A pipeline graph is a visual representation of the stages and dependencies within a data or automation pipeline. It shows how data or processes flow from one step to the next, making it easier to understand structure, identify bottlenecks, and troubleshoot errors.
In Salus, a pipeline graph serves as a central tool for:
- Visualizing execution flow
- Monitoring real-time status of each stage
- Exploring metrics, logs, and outputs in context
Nodes (Stages)
Each node represents a step in the pipeline. Each node displays
- Stage Name i.e. Prepare, Build, Test, Security and Deploy
- Status Badge i.e. Success, Pending, Skipped, Error, Cancelled
- Associated Tasks i.e. Git-clone, Build etc
- Action Buttons for to navigate you to logs, metrics and deployments where applicable
Edges (Connections)
The lines between nodes represent dependencies or data flow:
- Linear flow (A → B → C)
- Conditional paths (e.g., only continue if A succeeds) such as deploy stage. Learn how to set rules for your pipelines
- Parallel branches (A splits to B and C simultaneously). Only occurs if pipeline rules have been set
Reviewing findings from your pipelines will help you and your team understand, manage and control the quality of your codebase.
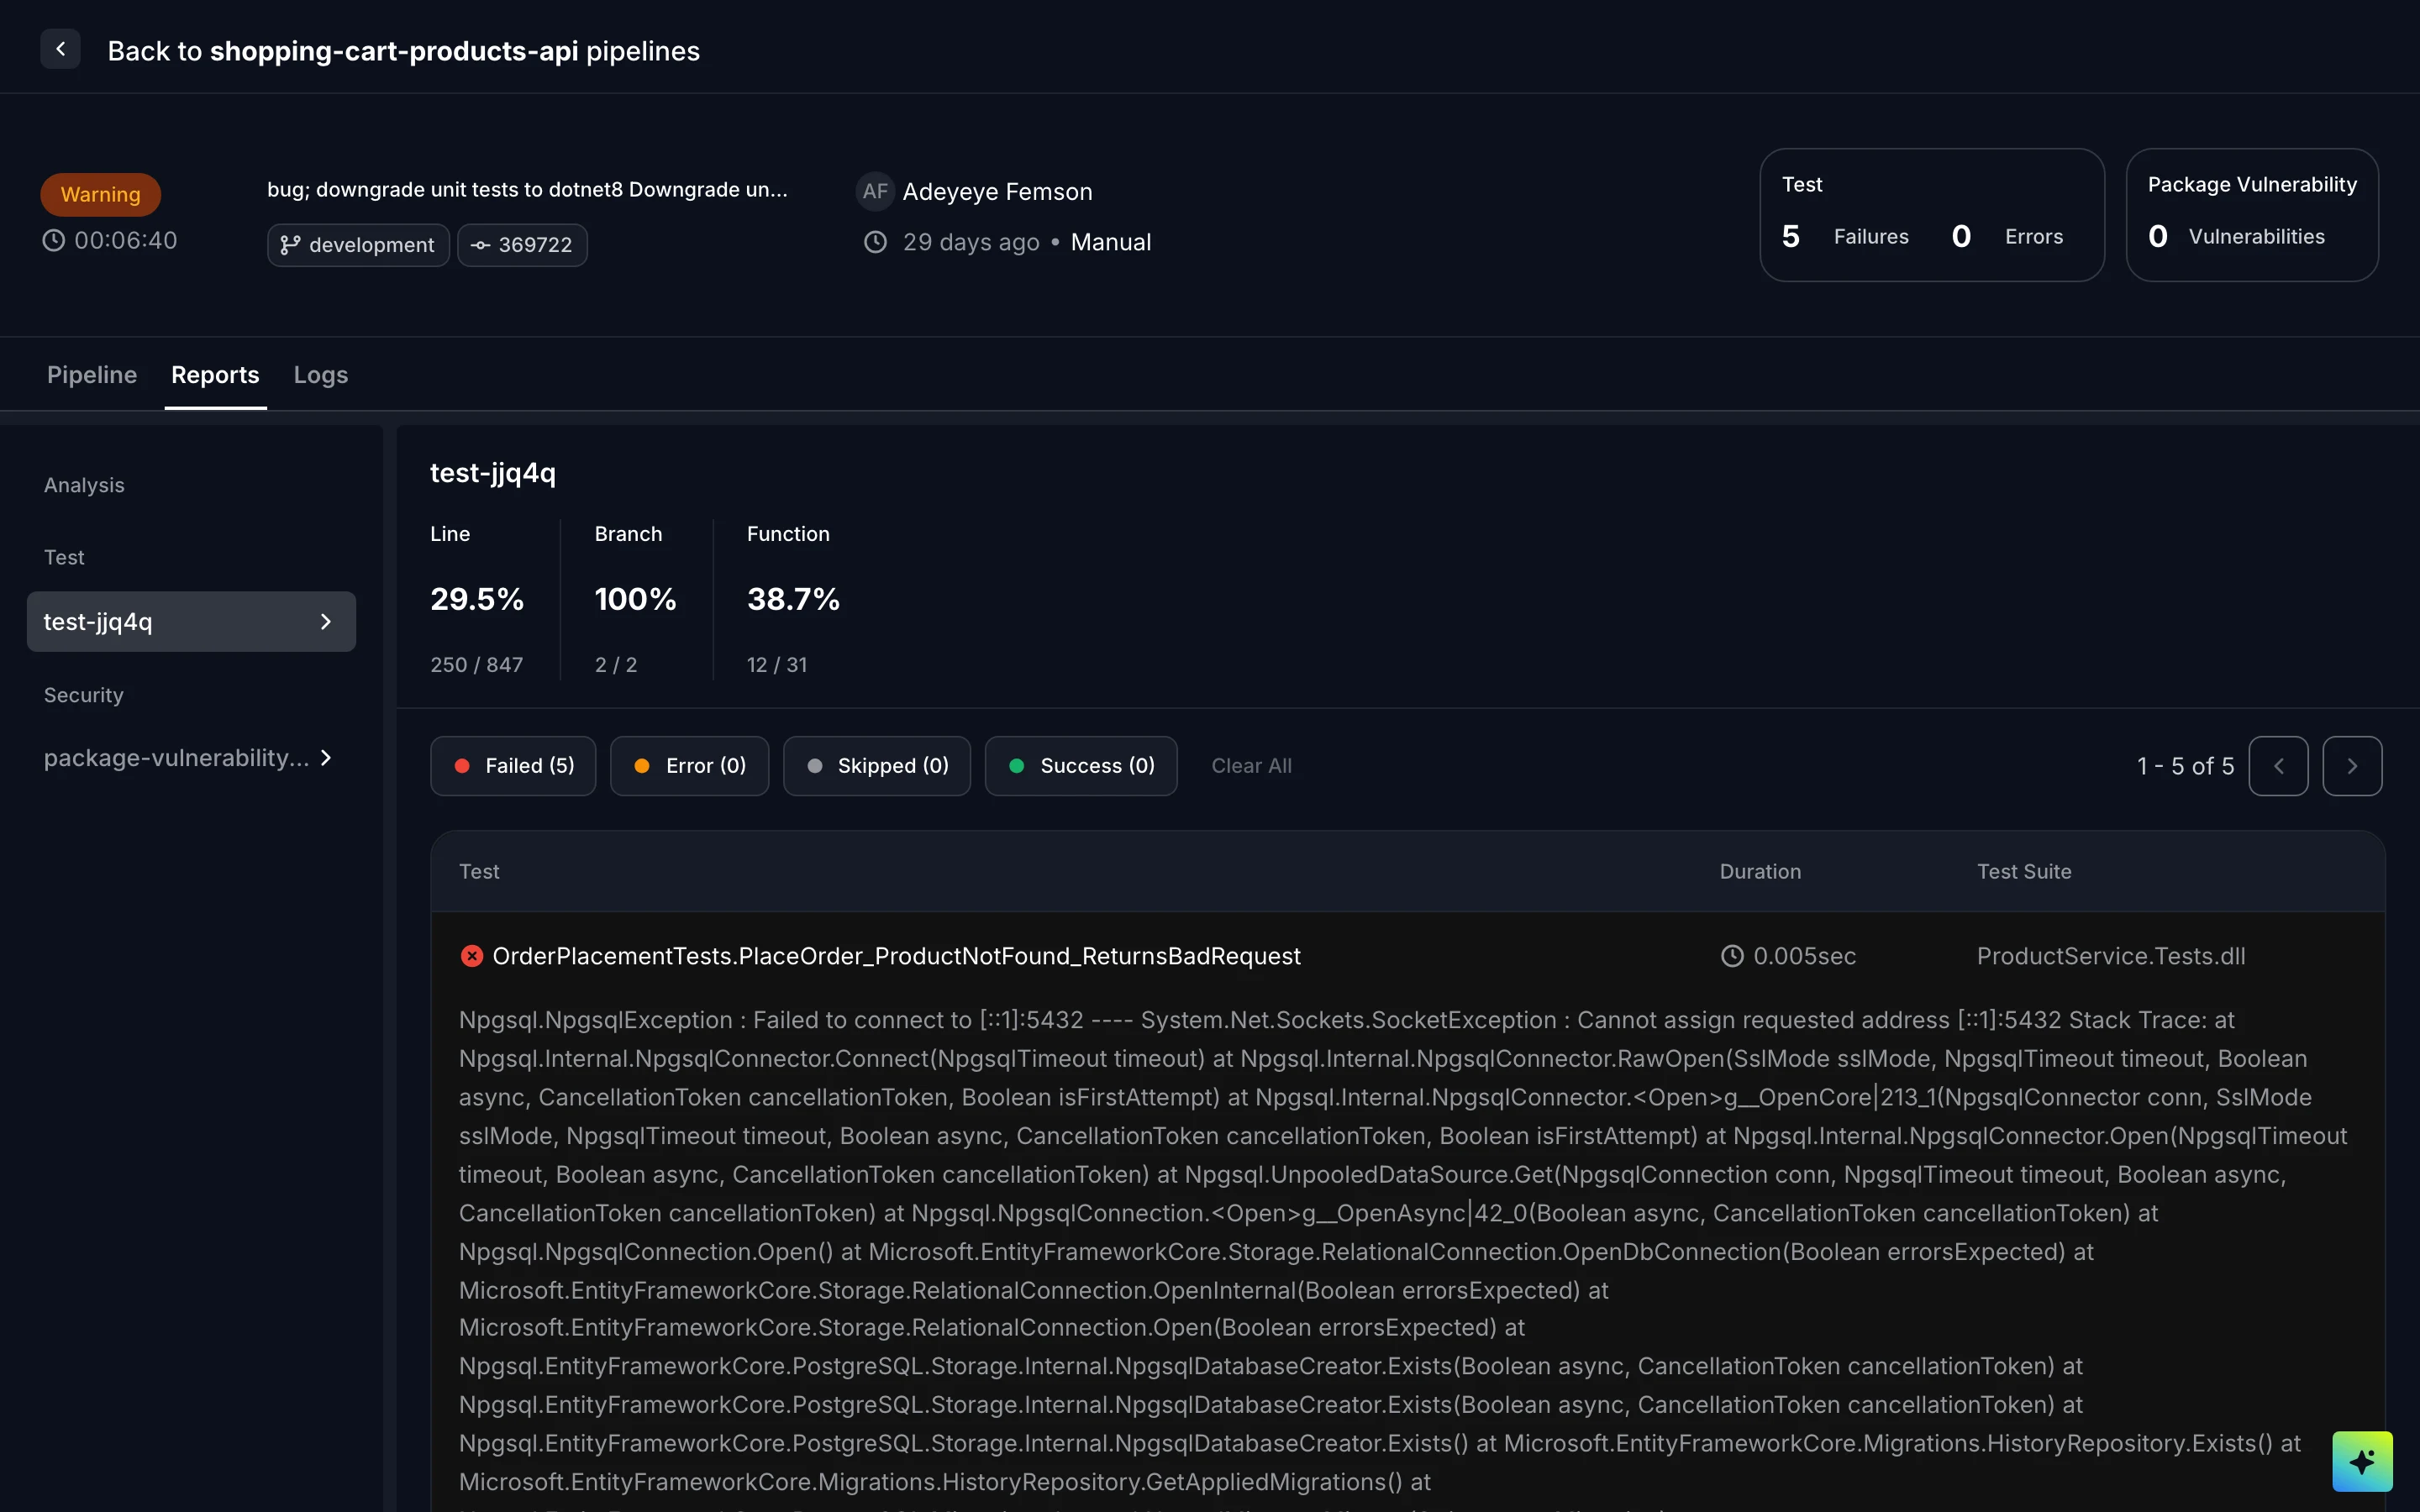
Findings from a stage report
Understanding your Pipeline Summary
Duration: Summarizes the amount of time it takes the pipeline from the build stage to the deploy stage
Test: Outputs test results from the unit testing stage and summarizes the number of failures and errors.
Security: Outlines number of vulnerabilities found in your pipeline
Understanding your Pipeline’s Dependencies
You can inspect stages and dependencies in your pipelines in the playground. Each card displays each stage, its related tasks and their real-time status.
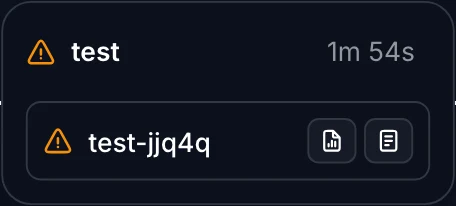
A stage card with its task and status
From the playground, you can quickly navigate to each tasks logs and reports by clicking on the icons in the cards where applicable.